As the title says, it is working, with the images running against a viable target i am able to separate the actual data perfectly for my sample case. The actual data, believe it or not, personally not keeping my hopes too high is being gathered this weekend. Apaarently the camera fell off the gimball on the flight last time...trust Aeronautical Engineers and you get burned.
Output from my Matlab Code:
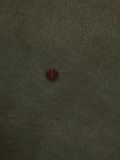
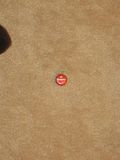
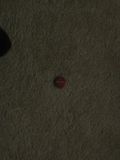
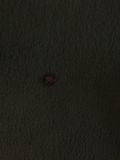
1: 0.152674 Empty
2: 0.208643 Empty
3: 0.166598 Empty
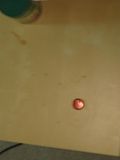
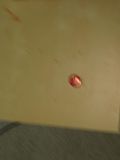
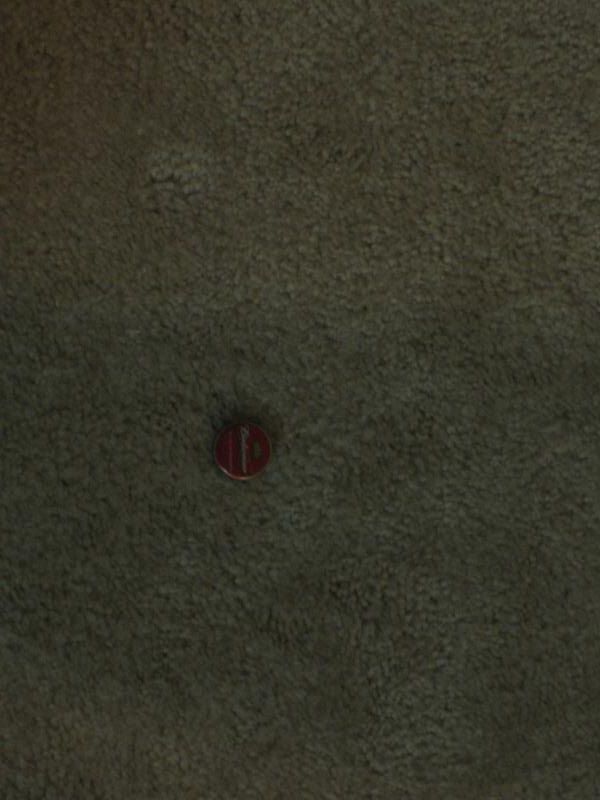
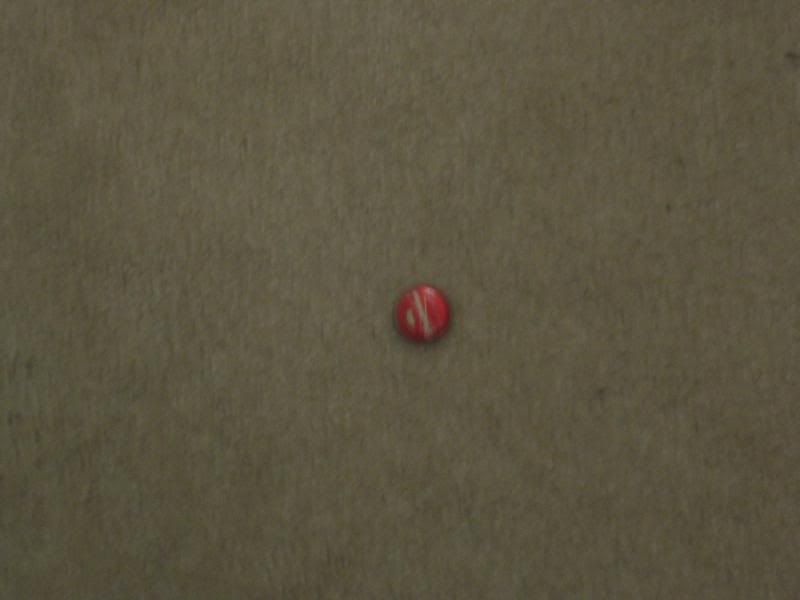
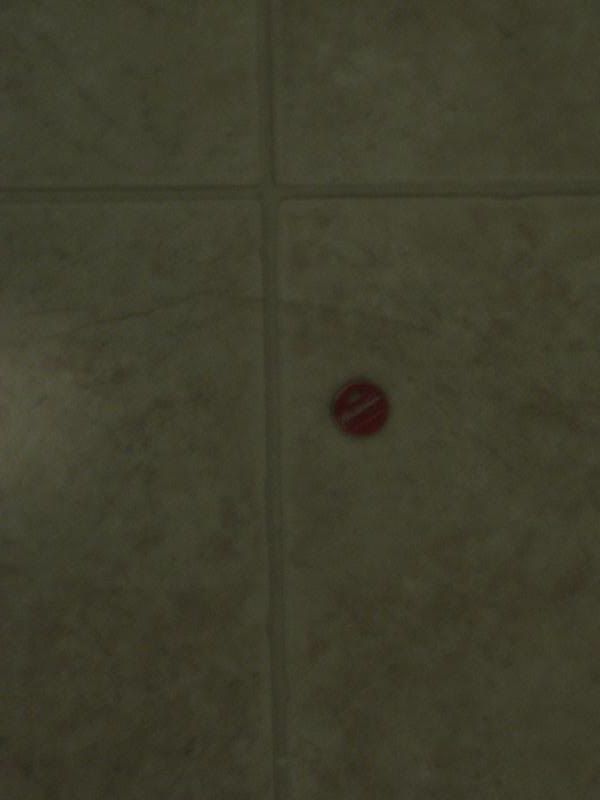
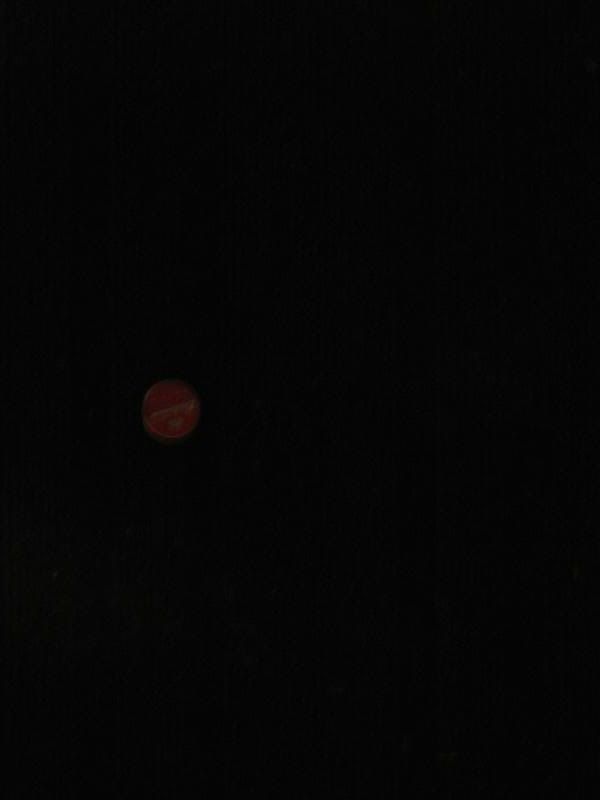
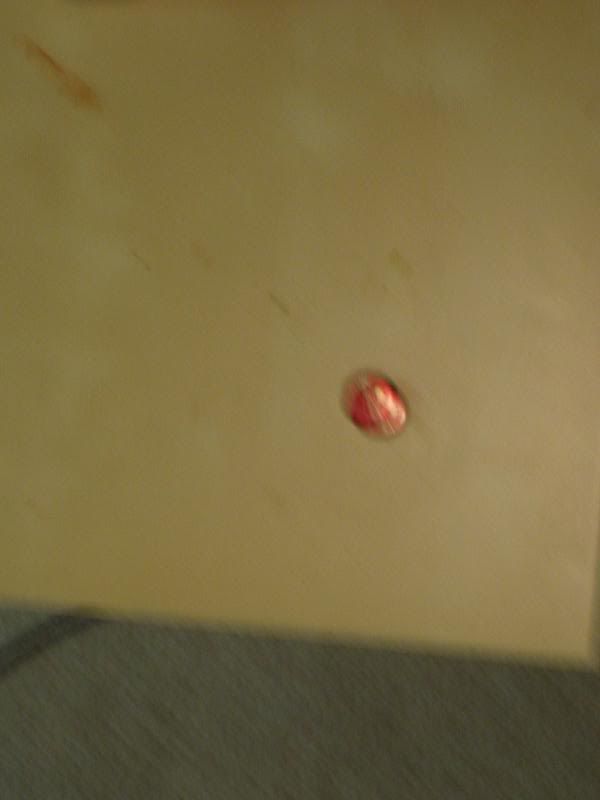
4: 0.005949 Present
5: 0.000491 Present
6: 0.138655 Empty
7: 0.188792 Empty
8: 0.203062 Empty
9: 0.977584 Empty
10: 0.177460 Empty
11: 0.136012 Empty
12: 0.204911 Empty
13: 0.111032 Empty
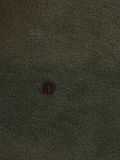
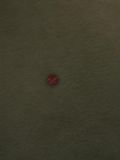
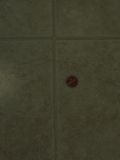
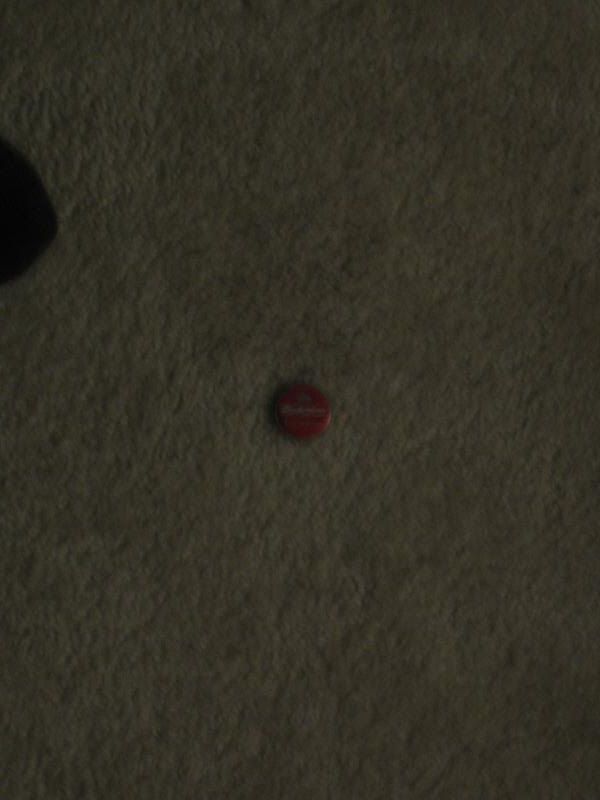
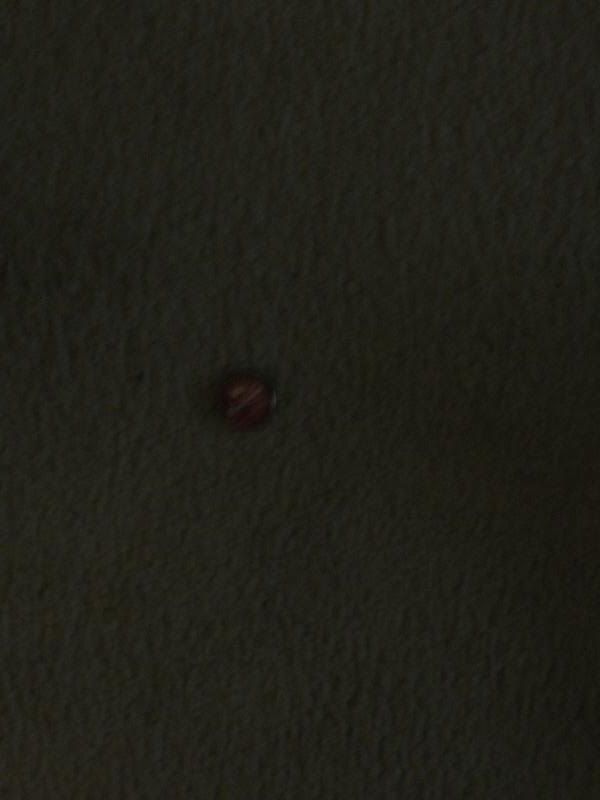
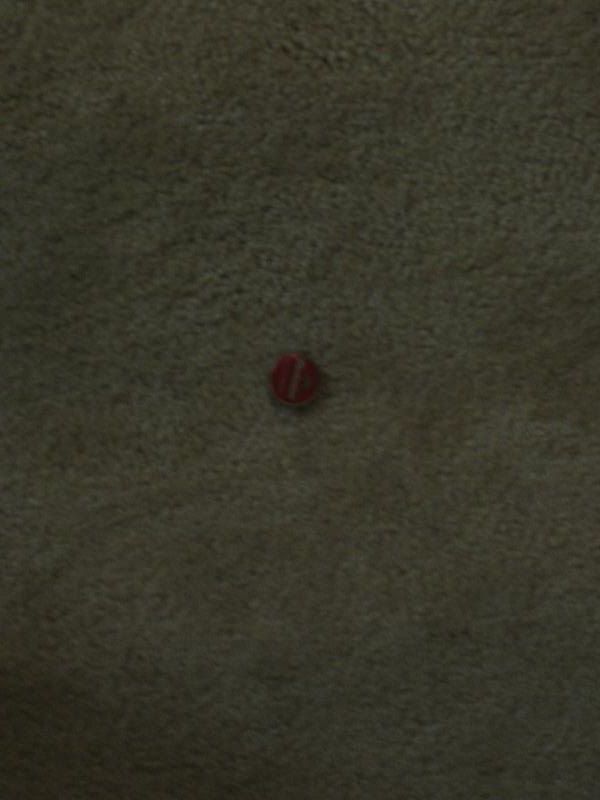
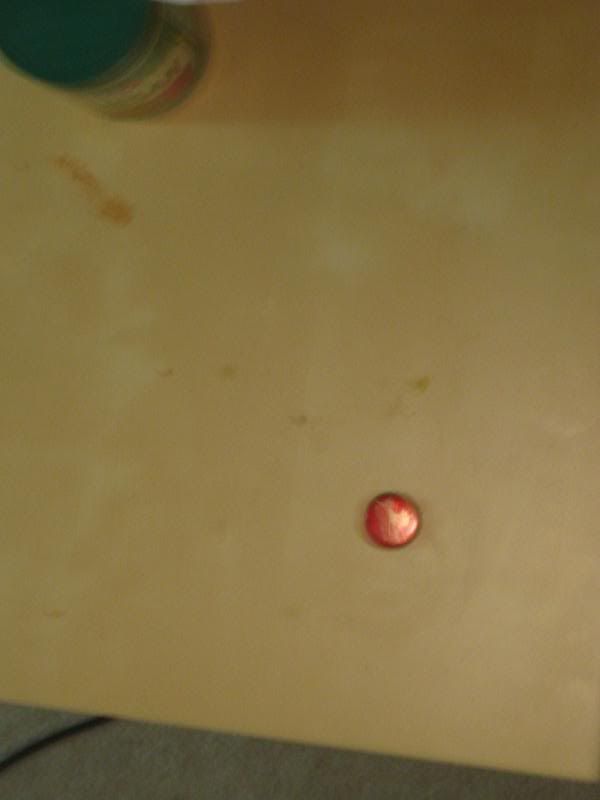
Images 4 and 5 are the 2 with the little red coke lids. At the moment i am partitioning the data based on, if it is a target it must return a chi squared less than 0.1. I have also run a sample on a bunch of targets to get a viable chi squared value and then doubled this limit and compared it against a variety of samples.
2: 0.087182 Present //actual target clear
3: 0.131061 Present //actual target clear
4: 0.114681 Present //actual target clear
5: 0.136188 Present //actual target on different but similar background
6: 0.250049 Empty //actual target on different and dark background
7: 0.065181 Present //actual target clear
8: 0.110614 Present //actual target clear
9: 0.396452 Empty //actual target with flash so very bright
10: 0.117868 Present //actual target clear
11: 0.094940 Present //actual target clear
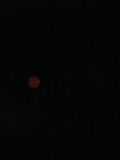
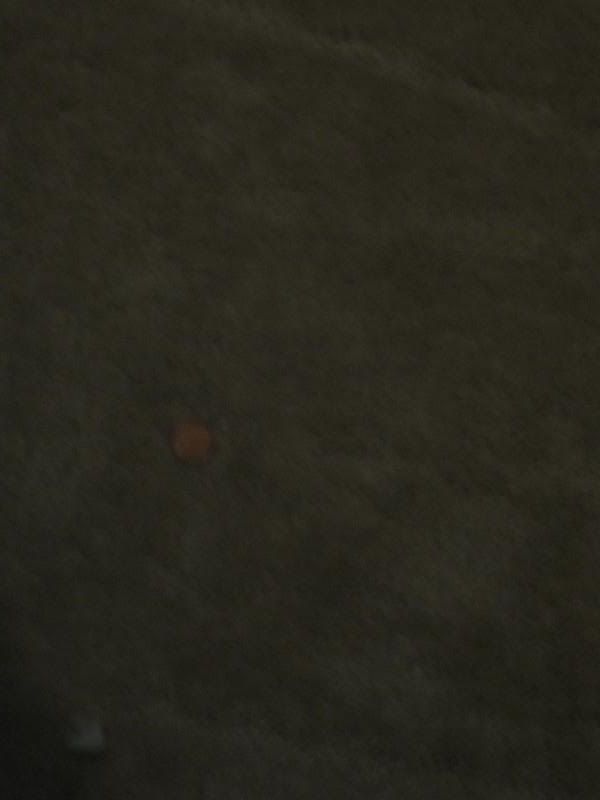
12: 0.291048 Empty //actual target in the very dark
13: 0.094446 Present //actual target clear
14: 0.282812 Empty //actual target on a table with alot of light
15: 0.230164 Empty //actual target on table with alot of light and blurred
16: 0.738673 Empty //empty image
17: 0.249815 Empty //part of a pizza box
18: 0.275440 Empty //empty image
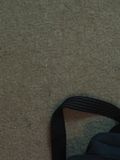
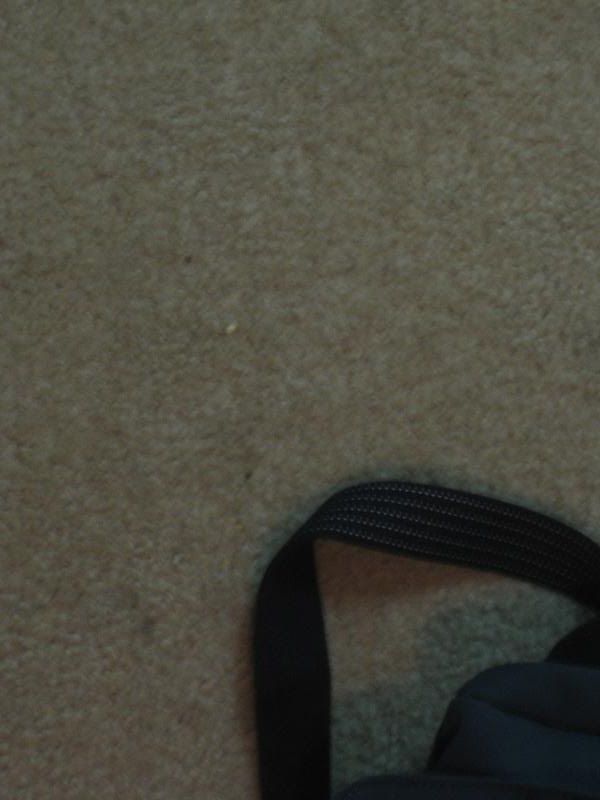
19: 0.151039 Present //bag strap
20: 0.167269 Present //chemistry book
21: 0.157746 Present //circular penny