Monday, March 17, 2008
Wednesday, March 12, 2008
Monday, March 10, 2008
Location
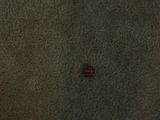
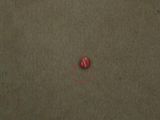
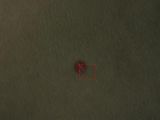
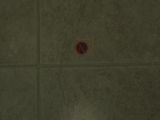
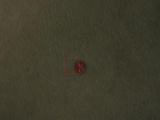
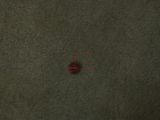
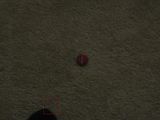
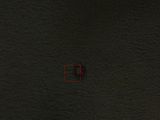
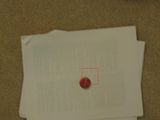
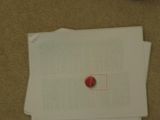
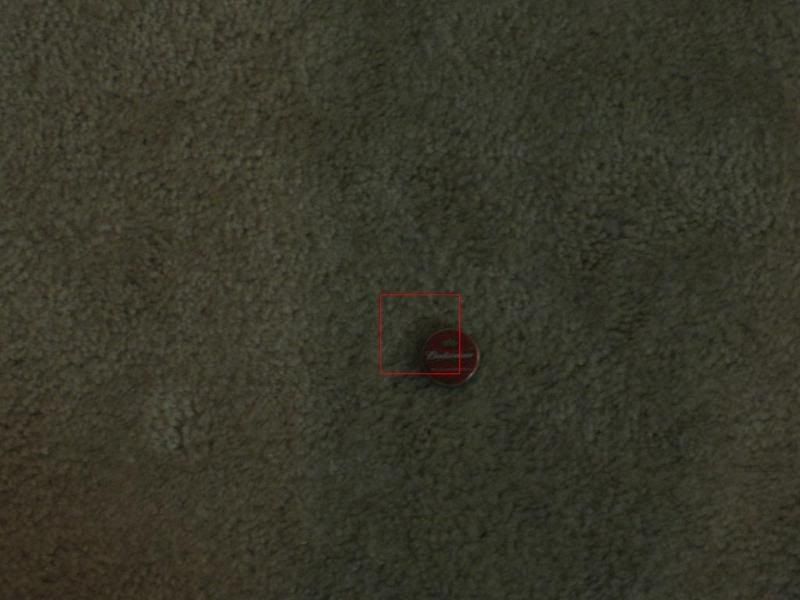
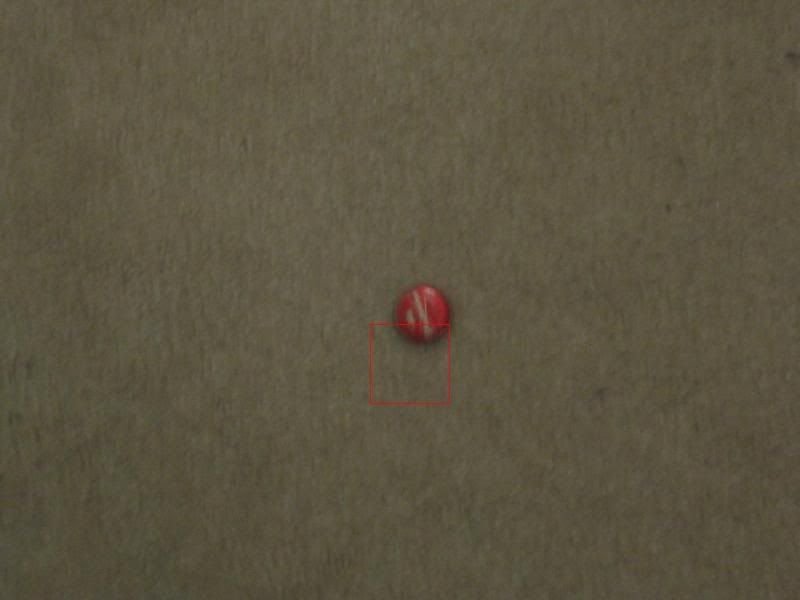
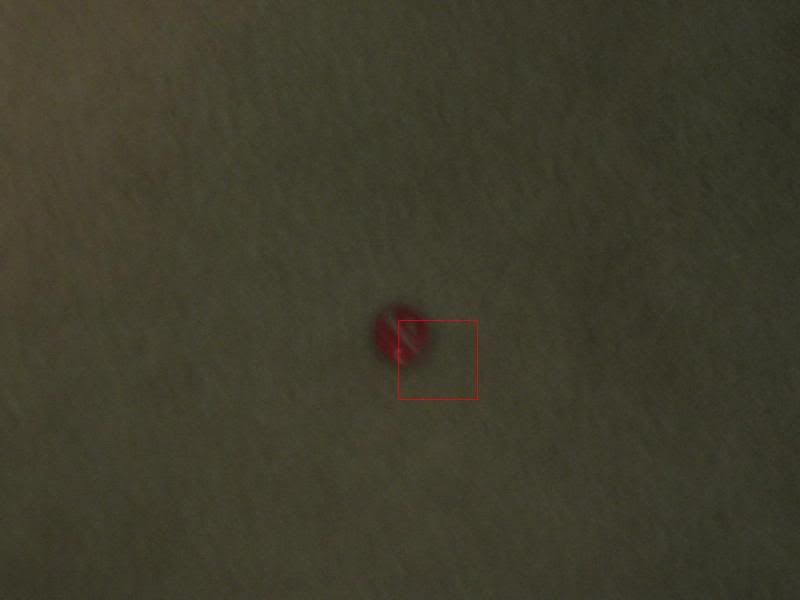
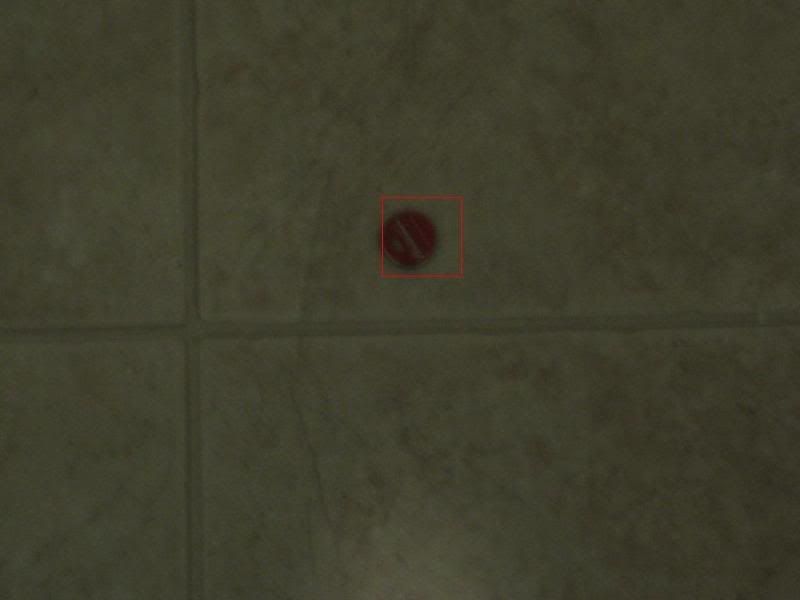
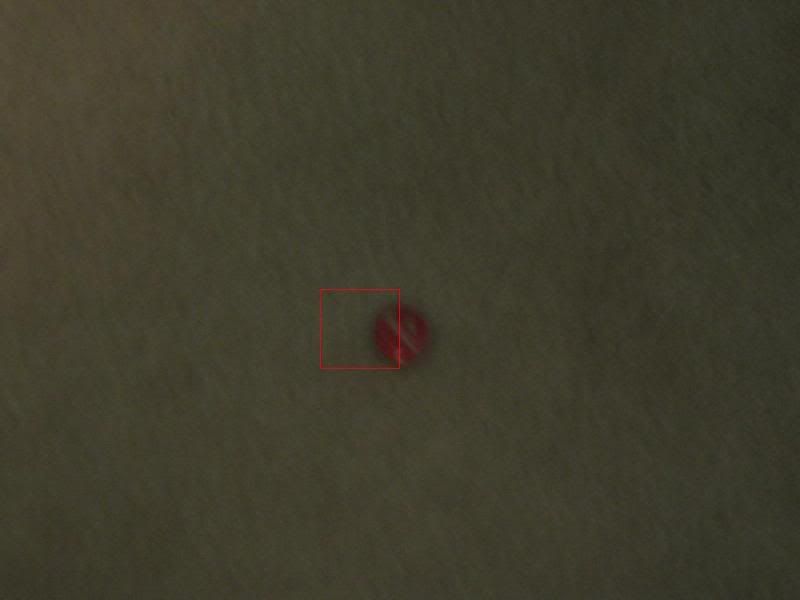
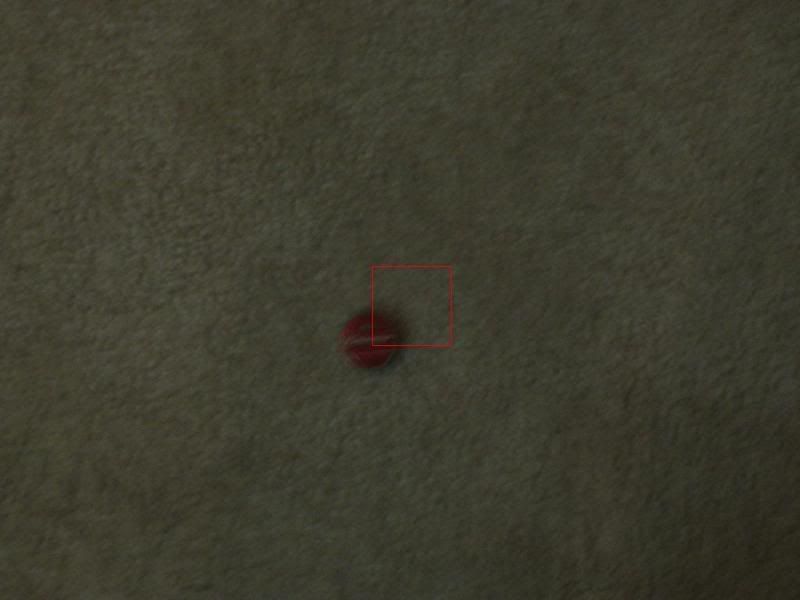
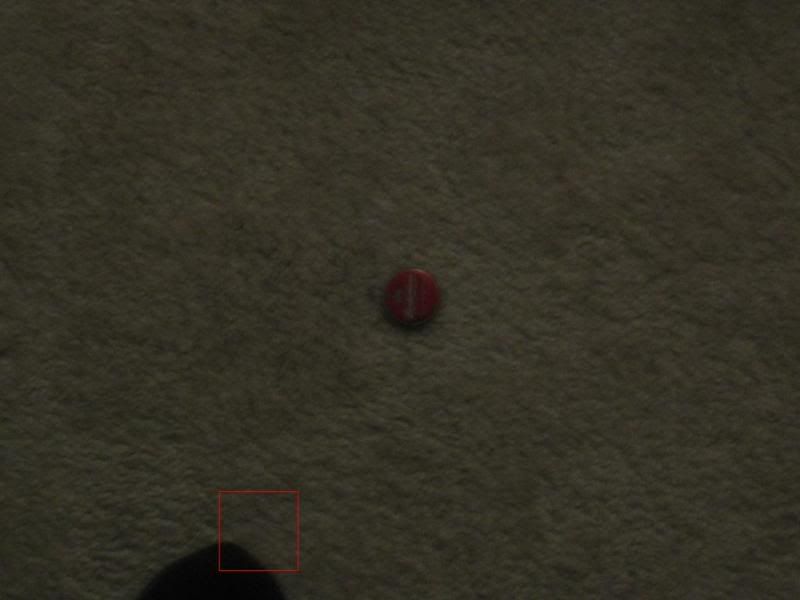
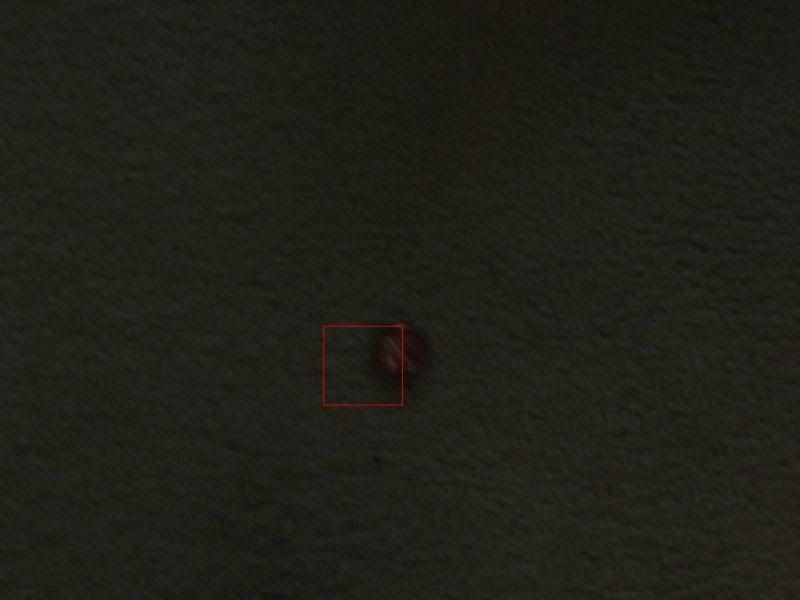
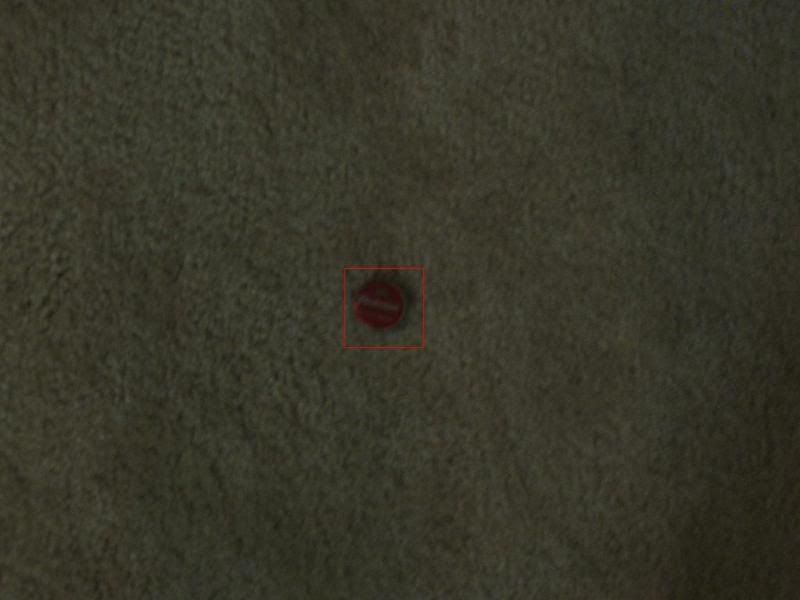
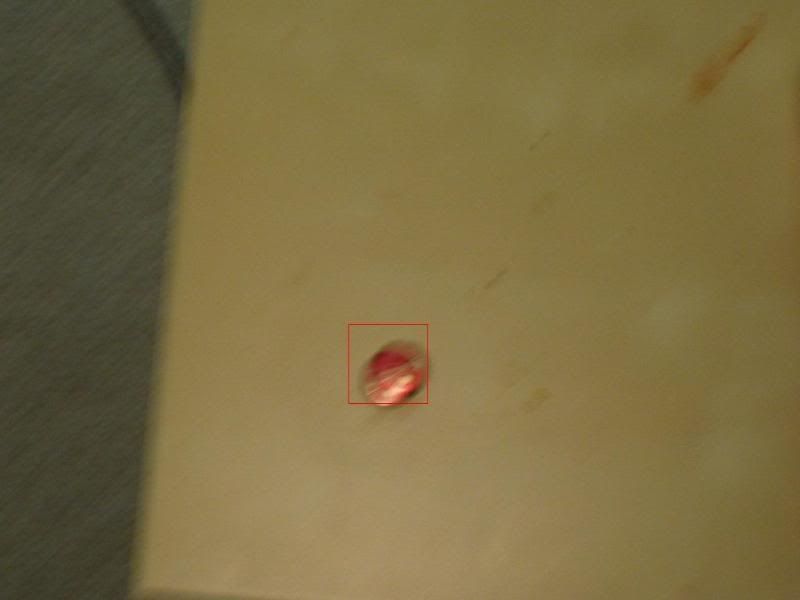
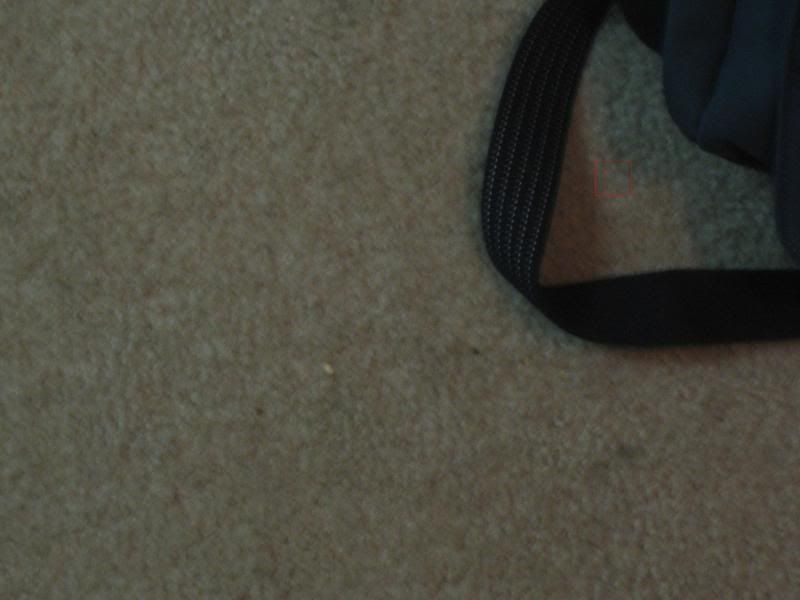
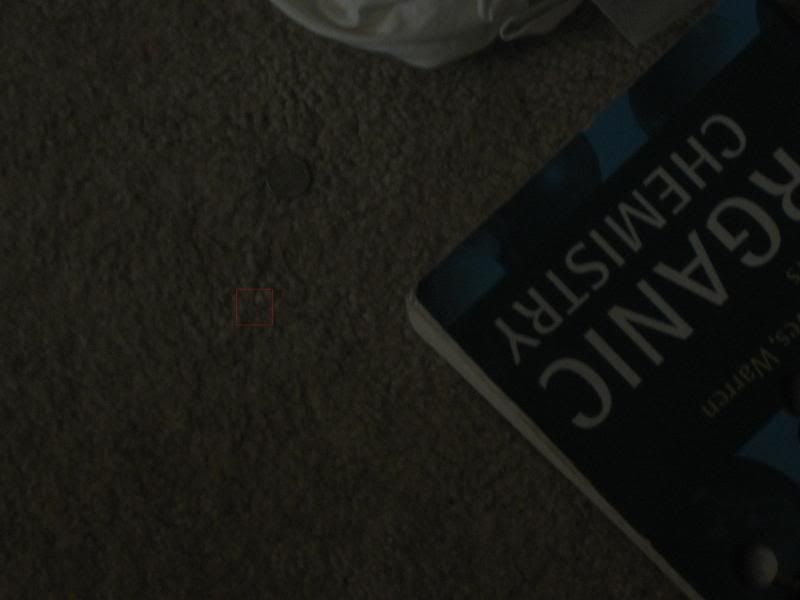
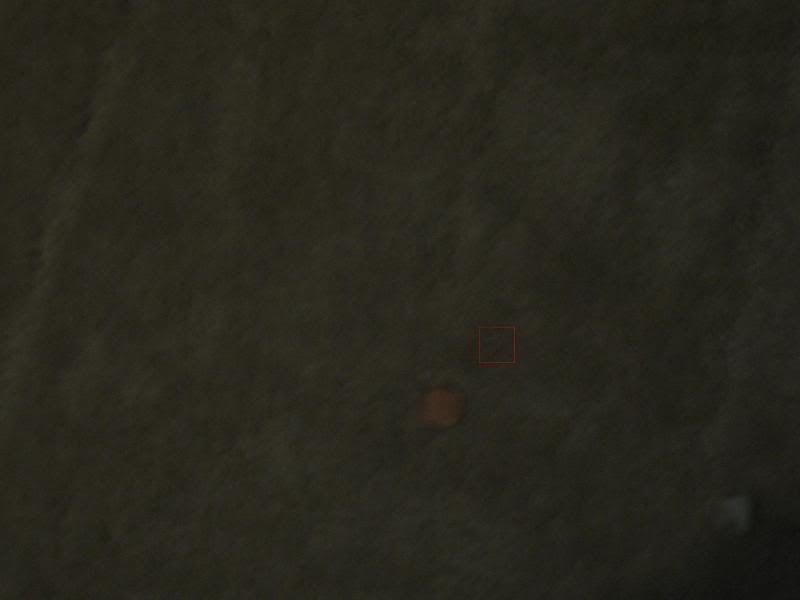
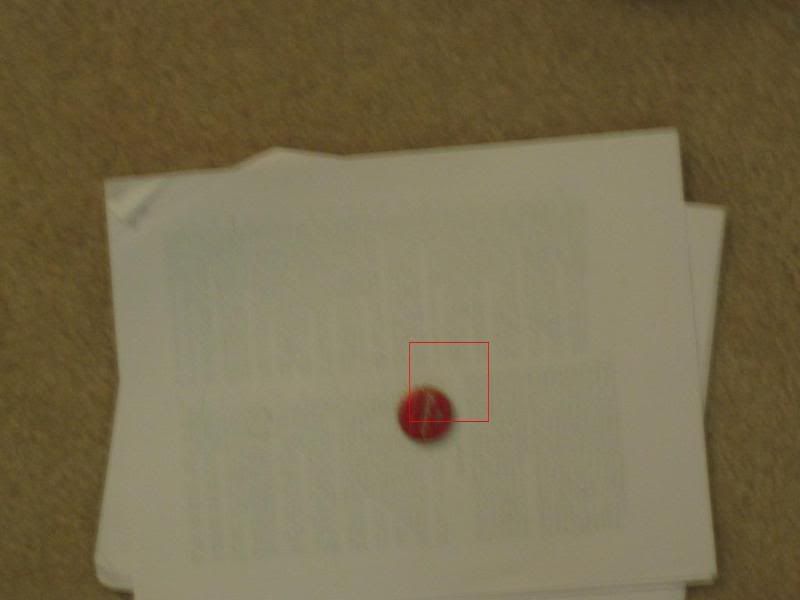
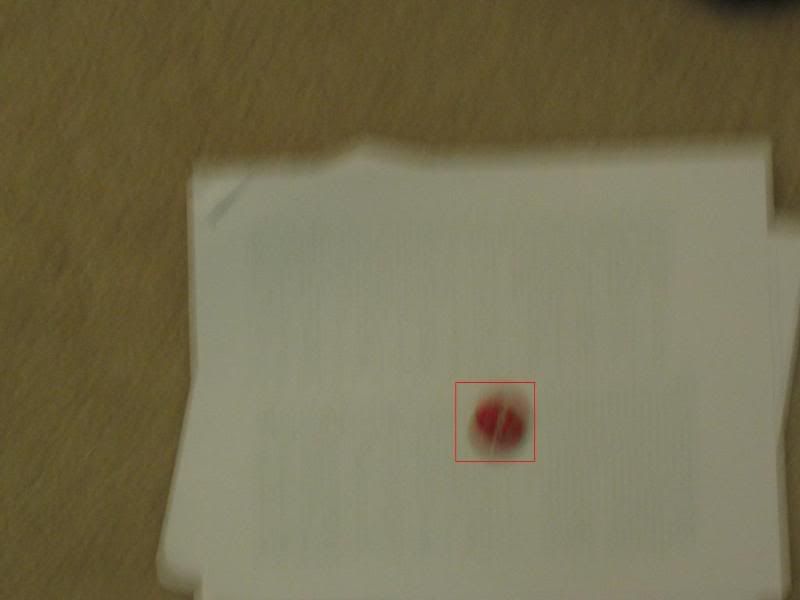
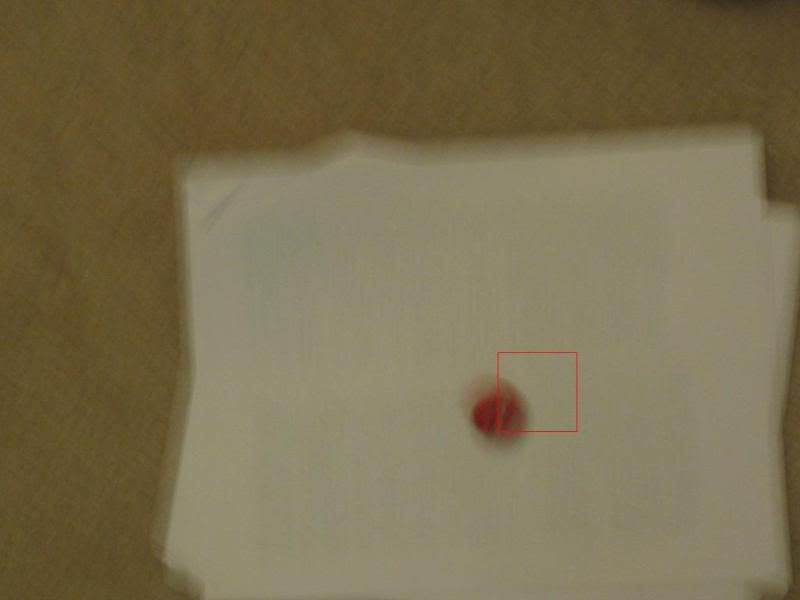
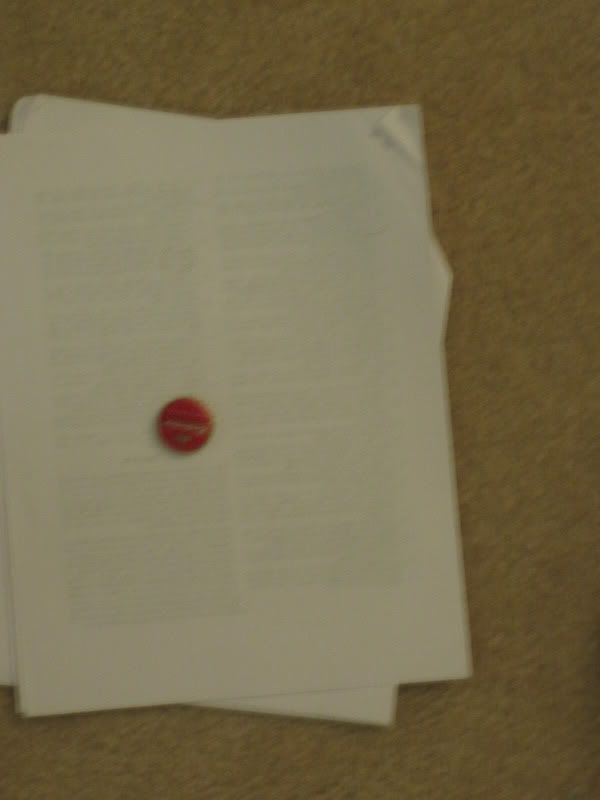
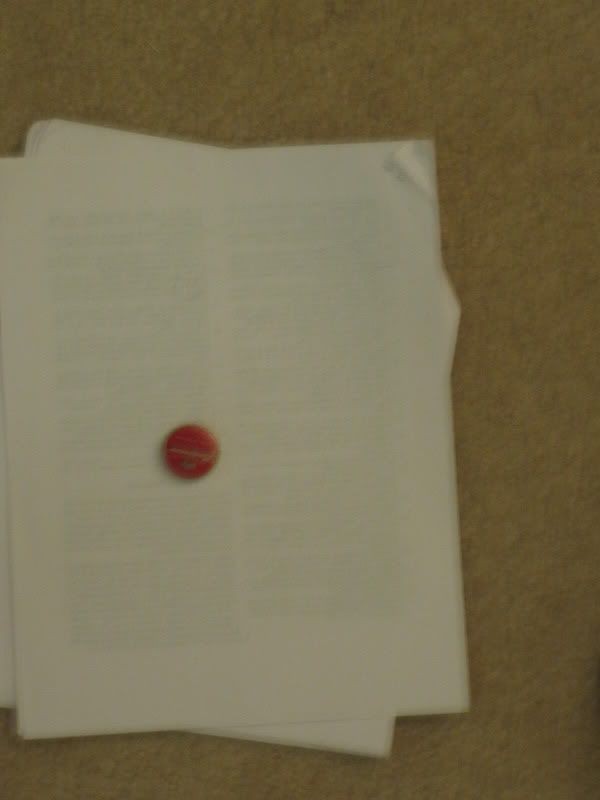
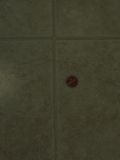
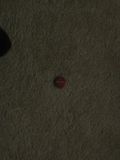
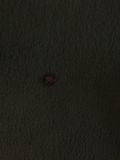
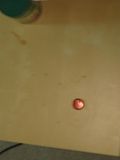
I have also over the weekend tried to implement a location based tool that allows me to visualise where the image targets found think that they actually are. I simply took the best matching window and plotted a red square around it to ensure that the chosen location can be visualised. also the Co-ordinates of this location have been taken from the center of the chosen window and printed to the output file.
To get the distance from the center we take arc tan of the field of view times the altitude to get the distance the whole image covers...then on a pixel distance we can decide how far from the center which will be the gps location of the plane (approx).
Image location boxes can be viewed below:


To get the distance from the center we take arc tan of the field of view times the altitude to get the distance the whole image covers...then on a pixel distance we can decide how far from the center which will be the gps location of the plane (approx).
Image location boxes can be viewed below:

Blurred Test Solves Several Cases
Testing the blurred images again i found a human error in my code due to reusing code from elsewhere in the program. It is now fixed and actually shows a good improvement in that all images are classified as Present if they truly are present. I have yet to see a test/sample case where the images have been incorrectly classified.
Also with the new blurred image code the images are now actually picking up previous blurred images too. Showing that a careful selection of varying conditions from illumination to blurred tests will give results that a usable throughout the system. Ideally a larger set of training data would be used rather than the minimal 12 training images currently working with, yet this gives reasonable results to the minimum degree of accuracy required...100% coverage of all target images, yet still allows through a few similar images that are not truly targets (i.e true negatives).
Also with the new blurred image code the images are now actually picking up previous blurred images too. Showing that a careful selection of varying conditions from illumination to blurred tests will give results that a usable throughout the system. Ideally a larger set of training data would be used rather than the minimal 12 training images currently working with, yet this gives reasonable results to the minimum degree of accuracy required...100% coverage of all target images, yet still allows through a few similar images that are not truly targets (i.e true negatives).
2: 0.119070 Present - Normal
3: 0.128092 Present - Normal
4: 0.082883 Present - Normal
5: 0.131328 Present - Normal
6: 0.072161 Present - Dark
7: 0.053662 Present - Normal
8: 0.159959 Present - Normal
9: 1.000000 Empty
10: 0.113700 Present - Normal
11: 0.156434 Present - Normal
12: 1.000000 Empty
13: 0.045220 Present - Normal
14: 0.077655 Present - Blurred Test        //Old Blurry image now found
15: 0.099331 Present - Blurred Test        //Old Blurry image now found
16: 1.000000 Empty
17: 1.000000 Empty
18: 1.000000 Empty
19: 0.181530 Present - Normal
20: 0.187497 Present - Normal
21: 0.183492 Present - Normal
22: 0.154783 Present - Normal              //Non blurry version of image
23: 0.140616 Present - Normal              //Non blurry version of image
24: 0.163971 Present - Normal              //New Blurry image found as a normal instead
25: 0.095063 Present - Blurred Test        //New Blurry image found
Blurred images Results
The blurred image results are quite bizarre. All the cases of blurred targets are found as well as the base cases too. These blurred images though are not linked to the blurred test images however but are classified by the light and normal image sets....very peculiar so i am now currently trying to debug the cases and see what the results are just for the blurred cases and what the return value is in this situation.
(Trying to add pictures but google has a network error)...
Ahh i solved it another way...apparently google died this morning.
(Trying to add pictures but google has a network error)...
Ahh i solved it another way...apparently google died this morning.
Wednesday, March 5, 2008
Improvements To Illumination Variation
I have made some changes to the base images that are used for the illumination variation, however i have found that the system required some tweaking in the range of what is classified as a target as often i have found that the avc difference in chi squared between the tests is too strick, to loosen this i have simply drawn a boundary of either the average chi squared or 0.1 which is the larger.
By doing so i get a better classification result for the images.
AVC: 0.191358 AVD: 0.032299 AVL: 0.014278
I see this as a massive improvement. I was always dubious about blurring and now i can see clearly that this is an issue i have still to fix but i hope that with a test of such an image with no blurring it is picked up. This would prove to me that the blurring is the issue and not the classification of that model/style of image.
Immediate Possibilities:
By doing so i get a better classification result for the images.
AVC: 0.191358 AVD: 0.032299 AVL: 0.014278
2: 0.109081 Present - Normal
3: 0.045300 Present - Light
4: 0.022777 Present - Light
5: 0.058292 Present - Light
6: 0.083343 Present - Dark
7: 0.030796 Present - Light
8: 0.063477 Present - Light
9: 1.000000 Empty //Actually Present just extremely bright.
10: 0.060175 Present - Light
11: 0.167384 Present - Normal
12: 1.000000 Empty //Actually Present just extremely dark.
13: 0.156815 Present - Normal
14: 1.000000 Empty //Actually Present images are blurred.
15: 1.000000 Empty //Actually Present images are bluured.
16: 1.000000 Empty
17: 1.000000 Empty
18: 1.000000 Empty
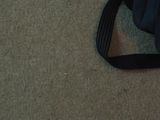
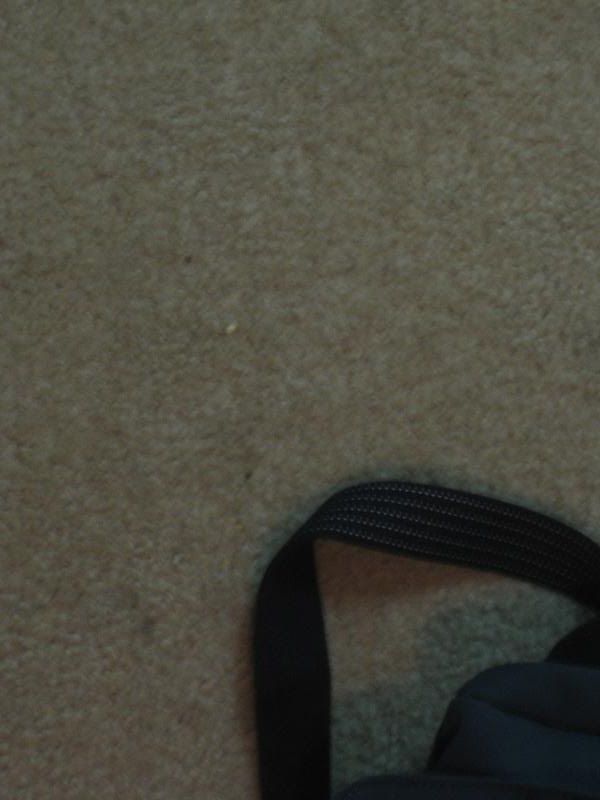
19: 0.187468 Present - Normal //Actually Empty image of bag strap
20: 0.171188 Present - Normal //Actually Empty image of chemistry book
21: 0.186641 Present - Normal //Actually Empty image of penny
I see this as a massive improvement. I was always dubious about blurring and now i can see clearly that this is an issue i have still to fix but i hope that with a test of such an image with no blurring it is picked up. This would prove to me that the blurring is the issue and not the classification of that model/style of image.
Immediate Possibilities:
- Test Blur Theory Against Non Blurry Images
- Check Dark Images for Improvements
- Target Location
Varying Illuimnation - Color Constancy Issues
After spending most of the weekend reading color constancy papers, and finding out things that seem to be quite damaging to my methods i have come across one great big artifact of them. When trying to give my system samples of varying lighting conditions and by artificially creating these as has been done before i have found that the samples although taken under similar conditions with the same camera in virtually the same place in the room have massively different values in the Hue channel thus ruining my results. However i do believe this is due to poor selection of target images, yet it does highlight that if this image had appeared in the live data set rather than the training one it would be misclassified. This is the issue in general with color constancy that human perception does not necesaarily match the machine representation of the image.
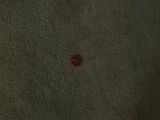
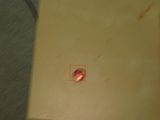
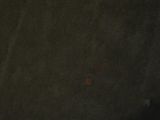
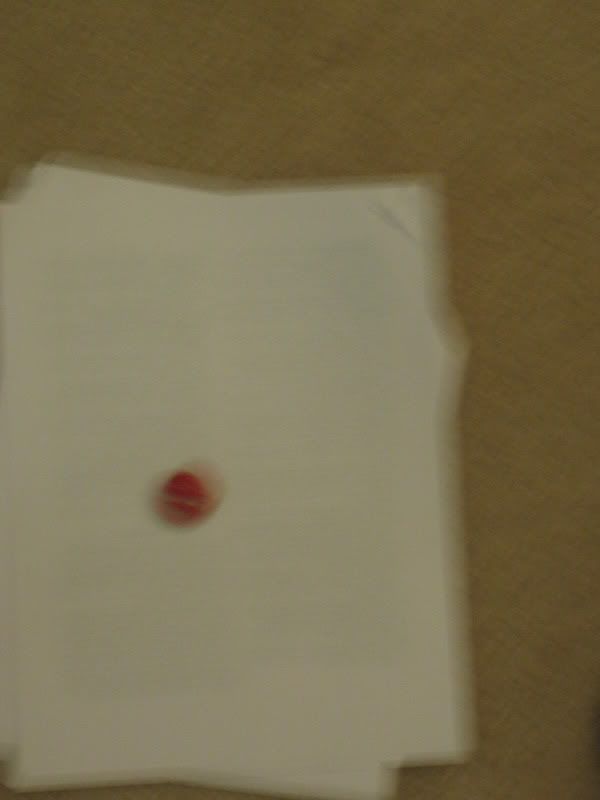
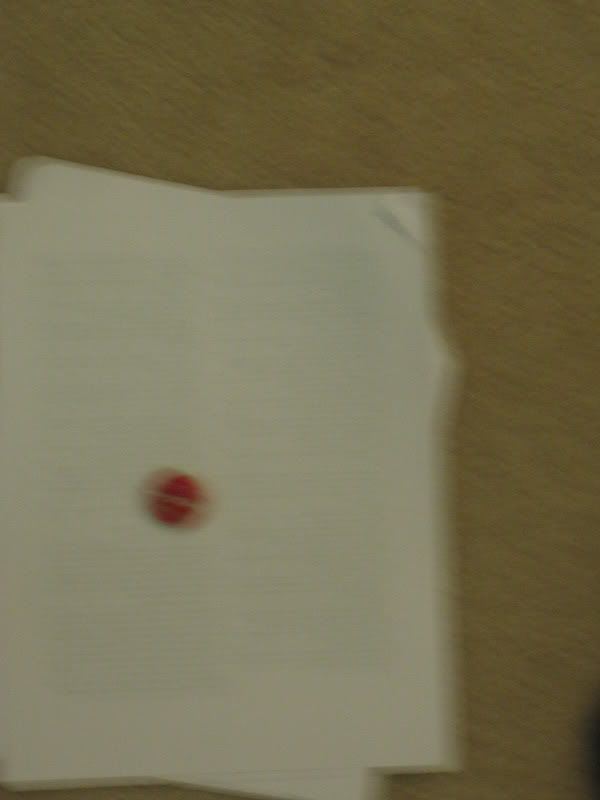
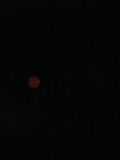
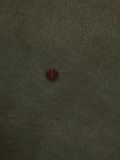
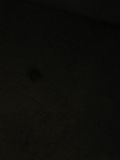
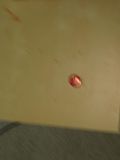
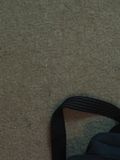
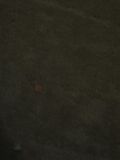
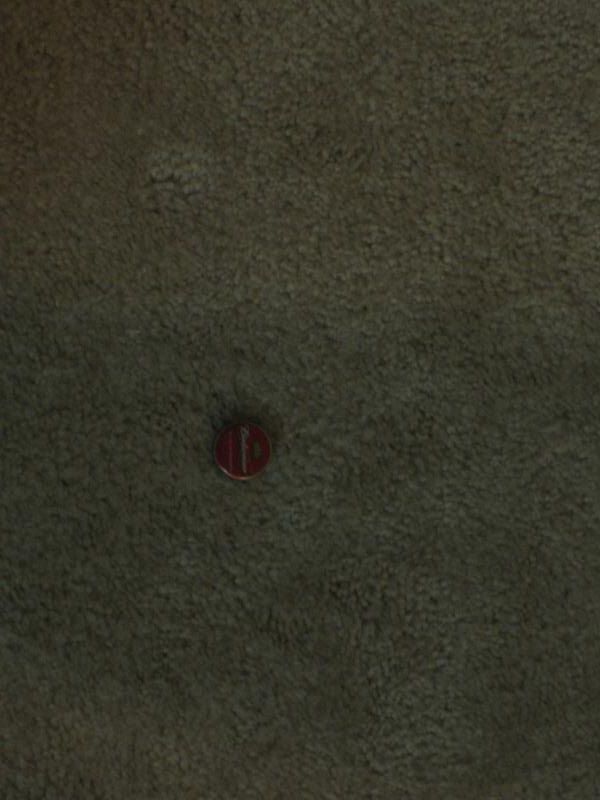
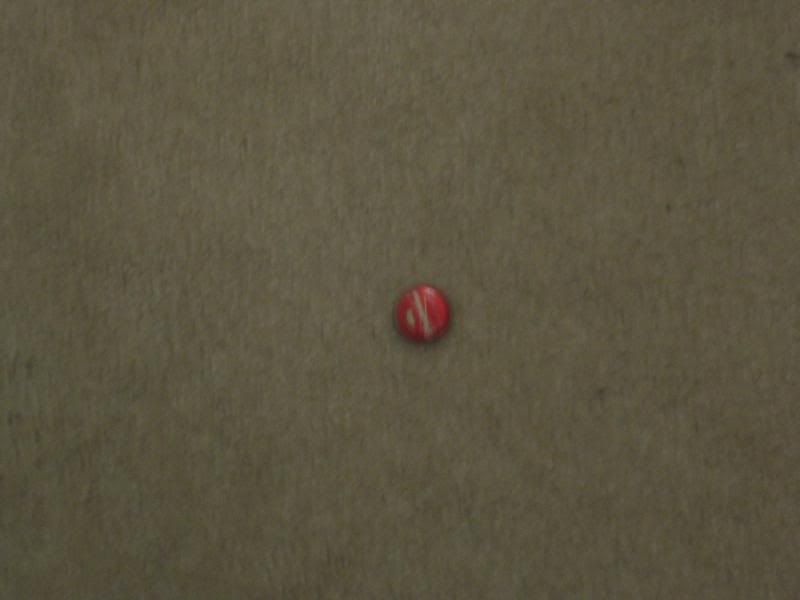
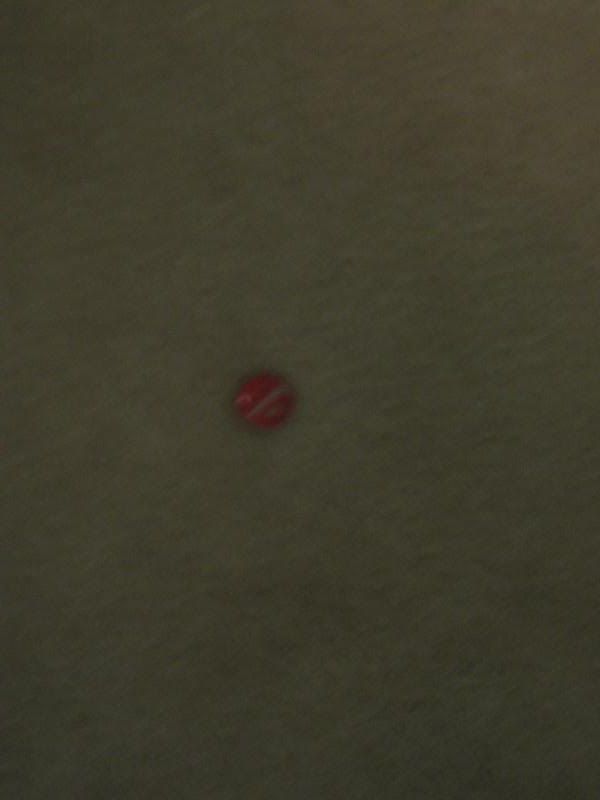
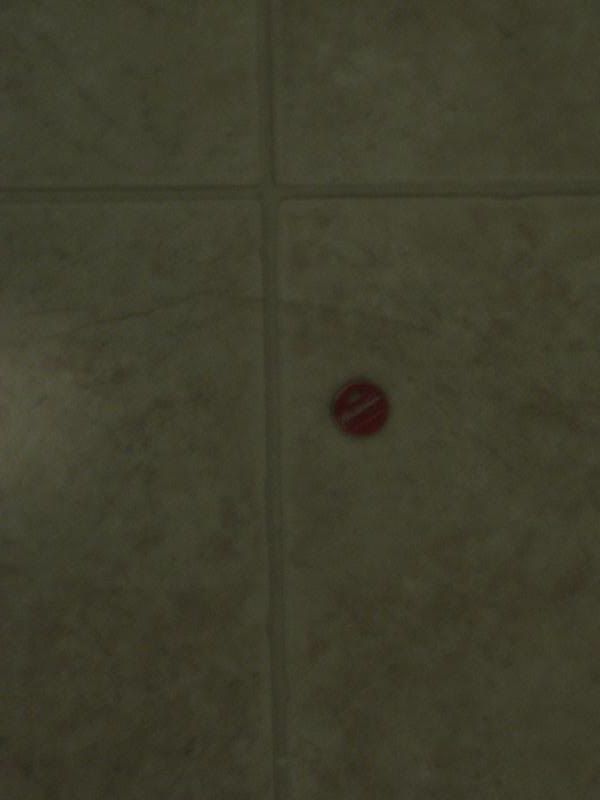
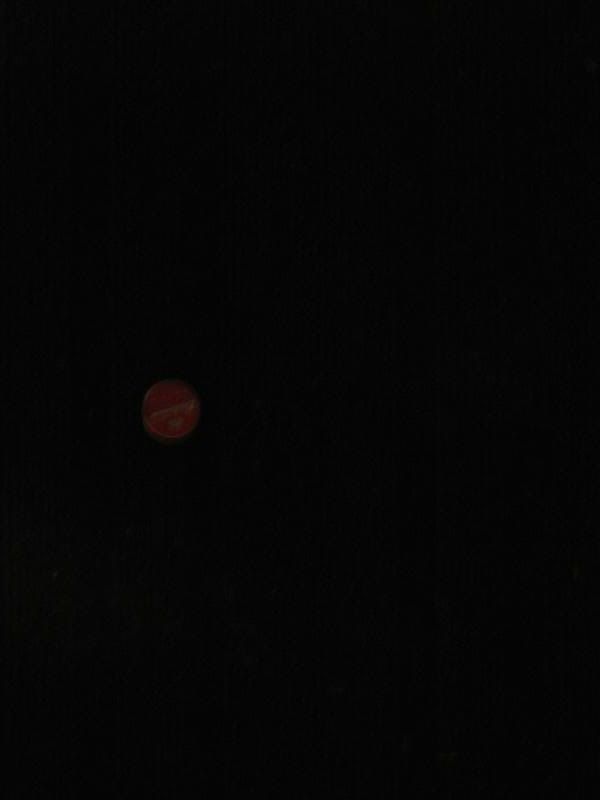
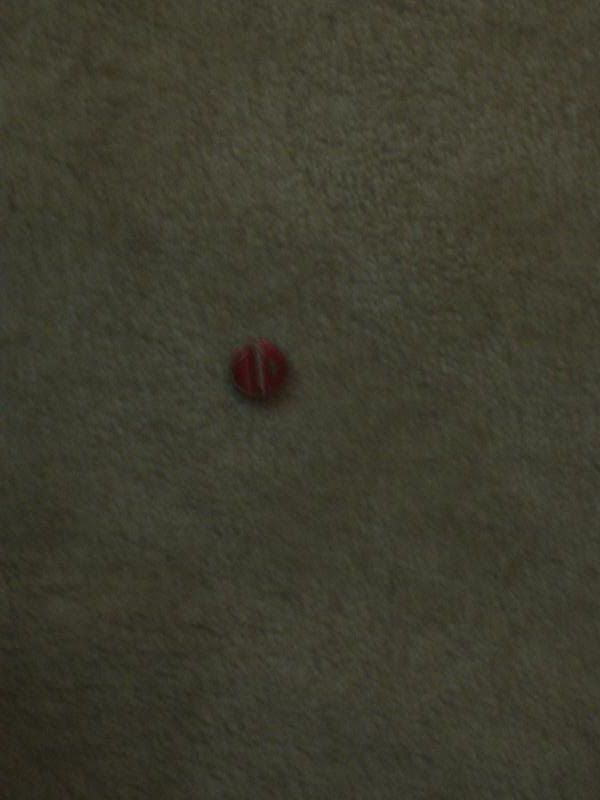
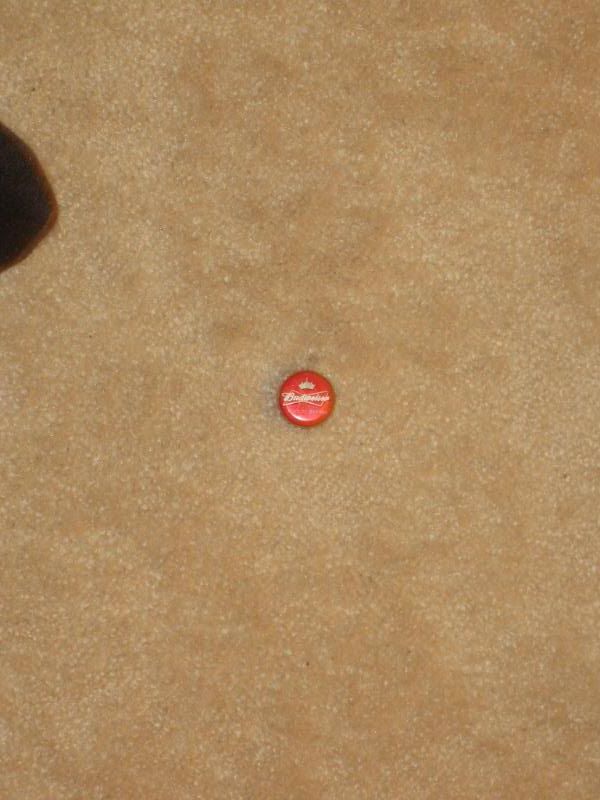
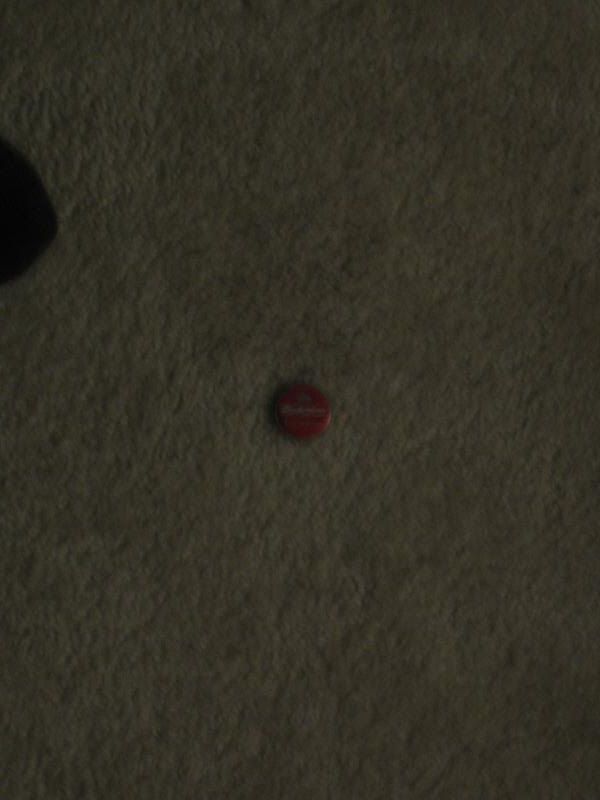
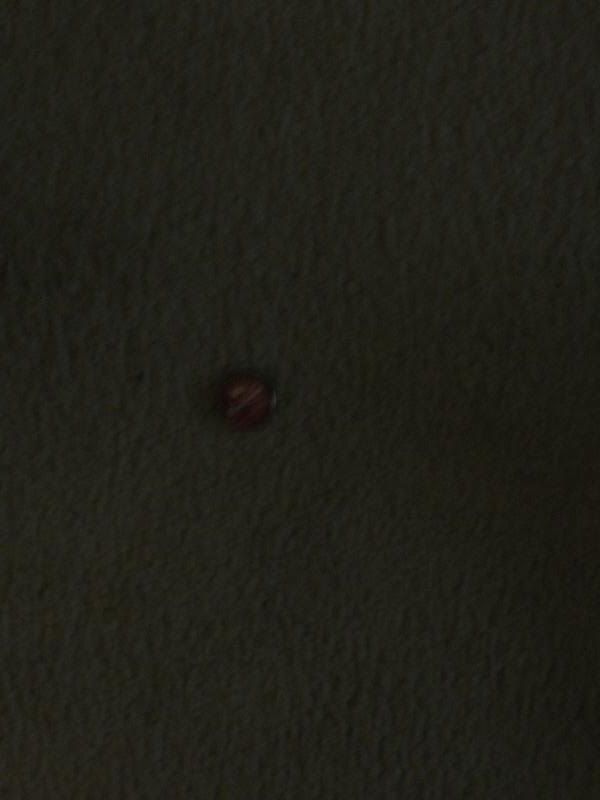
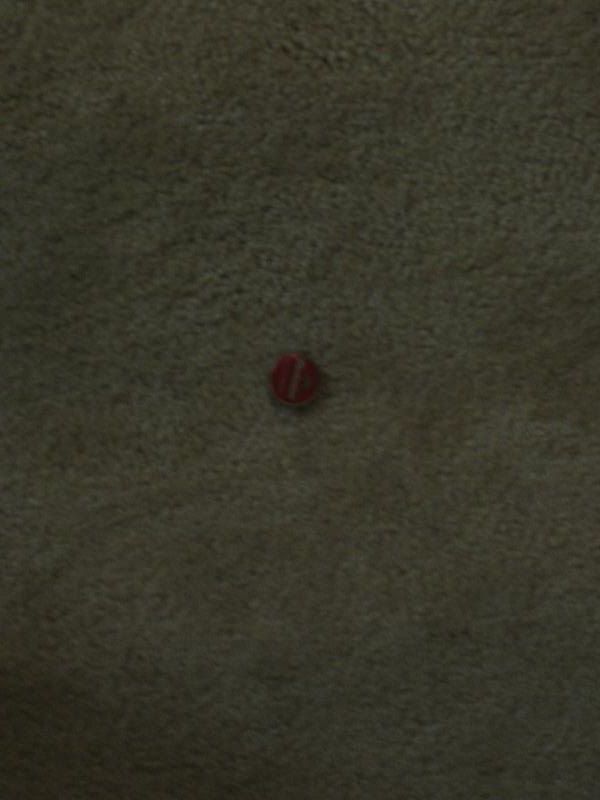
The images below are my samples for dark targets of a bottletop. Clearly they all contain something circular but it is hard to see, possibly red etc but not a clear view.
Yet in hue channels we can clearly see that there is a massive difference in these images as the right hand column is completely variant. This i believe to be color constancy or rather the lack of color constancy in effect.
The images below are my samples for dark targets of a bottletop. Clearly they all contain something circular but it is hard to see, possibly red etc but not a clear view.


Yet in hue channels we can clearly see that there is a massive difference in these images as the right hand column is completely variant. This i believe to be color constancy or rather the lack of color constancy in effect.

Monday, March 3, 2008
Tuesday, February 26, 2008
I lied...
One image fails with random chance...no idea why. It makes little to no sense to me. All the others look to be consistent.


HSV Based Histogram Analysis of Targets Gives CORRECT Separation
As the title says, it is working, with the images running against a viable target i am able to separate the actual data perfectly for my sample case. The actual data, believe it or not, personally not keeping my hopes too high is being gathered this weekend. Apaarently the camera fell off the gimball on the flight last time...trust Aeronautical Engineers and you get burned.
Output from my Matlab Code:
1: 0.152674 Empty
2: 0.208643 Empty
3: 0.166598 Empty
4: 0.005949 Present
5: 0.000491 Present
6: 0.138655 Empty
7: 0.188792 Empty
8: 0.203062 Empty
9: 0.977584 Empty
10: 0.177460 Empty
11: 0.136012 Empty
12: 0.204911 Empty
13: 0.111032 Empty
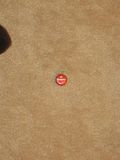
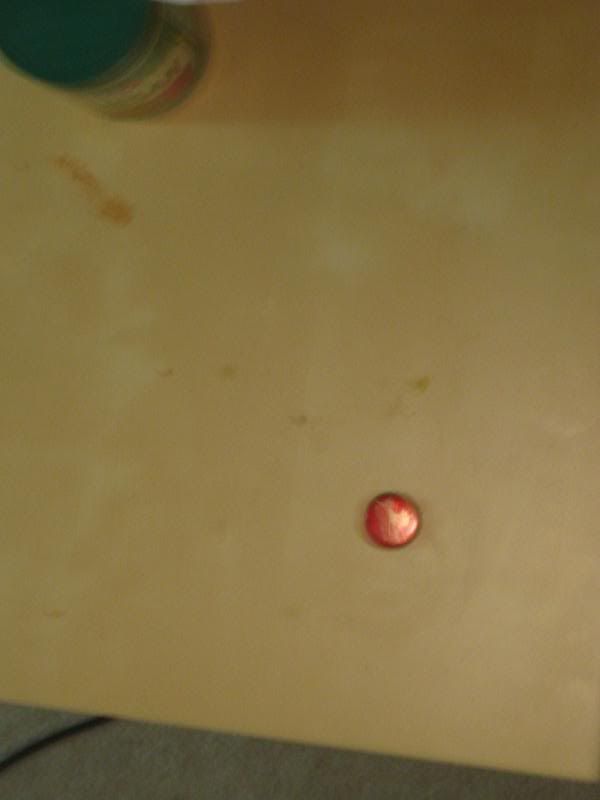
Images 4 and 5 are the 2 with the little red coke lids. At the moment i am partitioning the data based on, if it is a target it must return a chi squared less than 0.1. I have also run a sample on a bunch of targets to get a viable chi squared value and then doubled this limit and compared it against a variety of samples.
2: 0.087182 Present //actual target clear
3: 0.131061 Present //actual target clear
4: 0.114681 Present //actual target clear
5: 0.136188 Present //actual target on different but similar background
6: 0.250049 Empty //actual target on different and dark background
7: 0.065181 Present //actual target clear
8: 0.110614 Present //actual target clear
9: 0.396452 Empty //actual target with flash so very bright
10: 0.117868 Present //actual target clear
11: 0.094940 Present //actual target clear
12: 0.291048 Empty //actual target in the very dark
13: 0.094446 Present //actual target clear
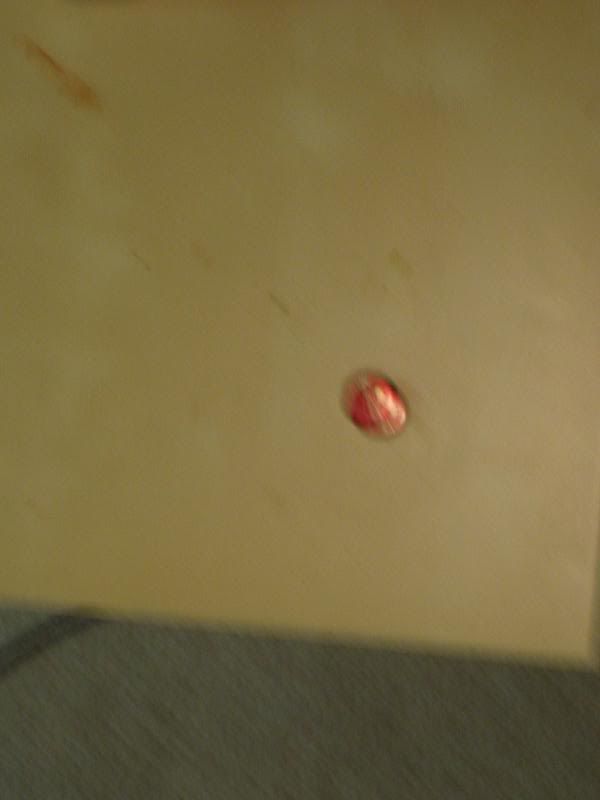
14: 0.282812 Empty //actual target on a table with alot of light
15: 0.230164 Empty //actual target on table with alot of light and blurred
16: 0.738673 Empty //empty image
17: 0.249815 Empty //part of a pizza box
18: 0.275440 Empty //empty image
19: 0.151039 Present //bag strap
20: 0.167269 Present //chemistry book
21: 0.157746 Present //circular penny


Output from my Matlab Code:
1: 0.152674 Empty
2: 0.208643 Empty
3: 0.166598 Empty
4: 0.005949 Present
5: 0.000491 Present
6: 0.138655 Empty
7: 0.188792 Empty
8: 0.203062 Empty
9: 0.977584 Empty
10: 0.177460 Empty
11: 0.136012 Empty
12: 0.204911 Empty
13: 0.111032 Empty
Images 4 and 5 are the 2 with the little red coke lids. At the moment i am partitioning the data based on, if it is a target it must return a chi squared less than 0.1. I have also run a sample on a bunch of targets to get a viable chi squared value and then doubled this limit and compared it against a variety of samples.
2: 0.087182 Present //actual target clear
3: 0.131061 Present //actual target clear
4: 0.114681 Present //actual target clear
5: 0.136188 Present //actual target on different but similar background
6: 0.250049 Empty //actual target on different and dark background
7: 0.065181 Present //actual target clear
8: 0.110614 Present //actual target clear
9: 0.396452 Empty //actual target with flash so very bright
10: 0.117868 Present //actual target clear
11: 0.094940 Present //actual target clear
12: 0.291048 Empty //actual target in the very dark
13: 0.094446 Present //actual target clear
14: 0.282812 Empty //actual target on a table with alot of light
15: 0.230164 Empty //actual target on table with alot of light and blurred
16: 0.738673 Empty //empty image
17: 0.249815 Empty //part of a pizza box
18: 0.275440 Empty //empty image
19: 0.151039 Present //bag strap
20: 0.167269 Present //chemistry book
21: 0.157746 Present //circular penny


Friday, February 15, 2008
Better than before
I have now updated the histogram to basically select the best chi value it finds from an image. If it is above a certain threshold then i can assume it has something in that portion of the image. However, this does work in the sense that all target values are passed through however some none targets seem to be creeping, i am going to play with the threshold level so that it works dynamically to maybe improve the efficiency of the program.
Currently the images 1-6 are TARGETS and 7-13 are EMPTY. The output from my matlab code gives the following results with no improvements or tweaking to the thresholds;
1: 0.037861 Present
2: 0.257812 Present
3: 0.033023 Present
4: 0.067213 Present
5: 0.094324 Present
6: 0.306998 Present
7: 0.015638 Empty
8: 0.015694 Empty
9: 0.949423 Present
10: 0.015573 Empty
11: 0.010490 Empty
12: 0.030843 Present
13: 0.012793 Empty
Thursday, February 14, 2008
Brute Force Histograms
I have improved a worked out the few obvious bugs with my former "histograms". Now as you can clearly see they are much more correct, and i have also altered my code to allow overlapping windows but they must differ by a window size of at least 1/4 this can be altered but i think for a start it is a good heuristic. It gives a decent coverage however the random generator doesn't seem to like the corners very much, i am not sure why as when i tested this at the start it gave me a variety of numbers from the minimum allowed to the maximum in the range, so i would expect them now maybe its simply a bad case?
The chi squared results though are lower than i had hoped, as you can see from these results they do not have a particular one which shines out as having or containing any useful information in fact the value is quite low and the margins not overly noticeable.
Chi Squared for sample image, larger values bolded.
0.0152         0.0146         0.0097         0.0097
0.0139         0.0143         0.0847         0.0050
0.0107         0.0022         0.0131         0.0086
0.0147         0.0125         0.0031         0.0152
0.0378         0.0108         0.0059         0.0035
0.0134         0.0511         0.0535         0.0062
0.0152         0.0052         0.0141         0.0929
0.0152         0.0470         0.0031         0.0102
0.0045         0.0029         0.0037         0.0071
0.0030         0.0038         0.0073         0.0105
0.0180         0.0050         0.0142         0.0061
0.0025         0.0074         0.0031         0.0138


Subscribe to:
Posts (Atom)